in8development | Project Slate
Project DESCRIPTION
in8development’s minimum viable product (MVP), code named Slate, is a clean, modern, user-centered design. It is a custom-built Windows 10 application. Users can quickly import evidence and other objects, to visually build and manage their investigations, and create reports.
My ROLE
I am responsible for all of the user research, as well as the entire application design: UX, visual, and interaction design. I also act as the product manager, and write all of the development specifications.
Users | Environment
Our team is advised by four Federal special agents who work complex financial crimes. I worked directly with the agents to understand their pain points, gaps in their existing solutions, and how they work their investigations. I also interviewed several Certified Fraud Examiners, to understand their persona as well; they are part of the initial target market.
Research
Note: For much more detail on my research and design process, check out: Select an Airplane Case Study
Canvas & Table
In order to design the canvas, I hosted a working session with the special agents to understand the problems they’re facing, and also to understand more about the mechanics of how an investigation is conducted. This resulted in several proposed options for canvas layout, interaction, and card styles.
The concept of a table existed as a placeholder well into the development of the application. This allowed for a lot of discussion, and research into potential solutions. Ultimately, because most investigations handle many, varied types of objects, a single Excel-style table would be inconvenient. Instead, I opted for repositionable and collapsible table cards that are grouped by object type.

Notes from user interviews on building an interactive workspace
Notes from user interviews on building a table viewer

Rough sketches of canvas concepts during initial interviews
Initial sketch of a table concept
Mockups
Canvas
Description
The canvas is the main workspace within Slate. This is where users visually build their investigation. There are products in the market that make similar visualizations; however, they don’t let users add background and understanding to relationships.
Problem
I was asked to find a way to replace whiteboards, stringboards and complex Visio-style files. Objects on the canvas need to show relationships, but those relationships also need to be qualified. There may be thousands of objects on a canvas; for ease of use, they need to be more than just an icon. Relationships need validating as well.
Solution
Through A/B testing, and user interviews, I determined that a simple contact-style card would be an ideal visualization of canvas objects. The interaction is pretty straight-forward: A user drags one or more objects onto the canvas. Dragging objects onto other objects creates links. If links require more information, like metadata, a workflow presents. The canvas allows for zooming in and out, so users can easily navigate around the objects.
Table
Description
The table shows all of the objects present on the canvas. The table serves several purposes: it supports the canvas by showing each object’s full properties, it provides a familiar visualization for Excel power users, and allows data export.
Problem
Our target end users are experts in Excel. But Excel isn’t the best visualization when the table would contain hundreds of object types, each with their own properties. The spreadsheet could be thousands of columns wide, and very hard to use.
Solution
Instead of using a traditional Excel-style spreadsheet, user research showed that my card-style approach better met their needs. Each object type is in its own table card. The cards are repositionable, and collapsible. Similar to Excel, columns are sortable, and can be filtered. Modifying data in the table automatically updates the database, and any other visualizations.
Fuzzydate
Description
It’s not just a date/time picker. The concept of a “fuzzydate” is unique to Slate. In fact, it is part of the product’s patent filing. The design had to support nearly unlimited vagueness when entering dates and time.
Problem
I had to design a solution that could handle the nuanced, occasionally nonspecific law enforcement vernacular for dates and times. Example: “The suspect purchased the car on or about 12:00 PM, sometime during the month of June, 2017."
Solution
I considered variations on a traditional date/time picker. I wanted something simple but intuitive. I added date/time qualifiers (e.g., On or About, Before, etc.), as well as unknown or to be determined values. I take advantage of the readout (on the left, in blue) to keep the user informed of their selections.
Fact Connector
Description
In order for an agent to charge a subject with a crime, they must have evidence that they believe proves an element of the legal statute. Generally this is tracked manually in a tool like Excel or Word.
Problem
During user interviews, I found out that this work is quite time intensive, and requires multiple applications to be successful. There is no integration between those applications and their investigation software.
Solution
Fact Connector allows a user to view the facts of their investigation, on the left, and associate them to elements of the crime they wish to charge, on the right. This auto-populates the required information (e.g., facts, evidence, legal statute) into the agent’s reports. Agents can very quickly associate elements of the crime with facts in the investigation.
Timeline
Description
Many products exist in the market to build and visualize items on a timeline. While some of these solutions do meet the agents’ requirements, their functionality doesn’t go far enough.
Problem
Timeline software is fairly rudimentary. Our special agents often use Visio for this. Either way, the work done is all manual and has to be updated manually as well.
Solution
After a few design exercises, I honed in on two features that would elevate the timeline solution: The ability to see related objects on the timeline, and the ability to see multiple timelines in a single view. These provide additional context to a fact-based view, as well as allow users to easily look for patterns on the timeline, or compare similar events. All views of the timeline are synced with data from the canvas.
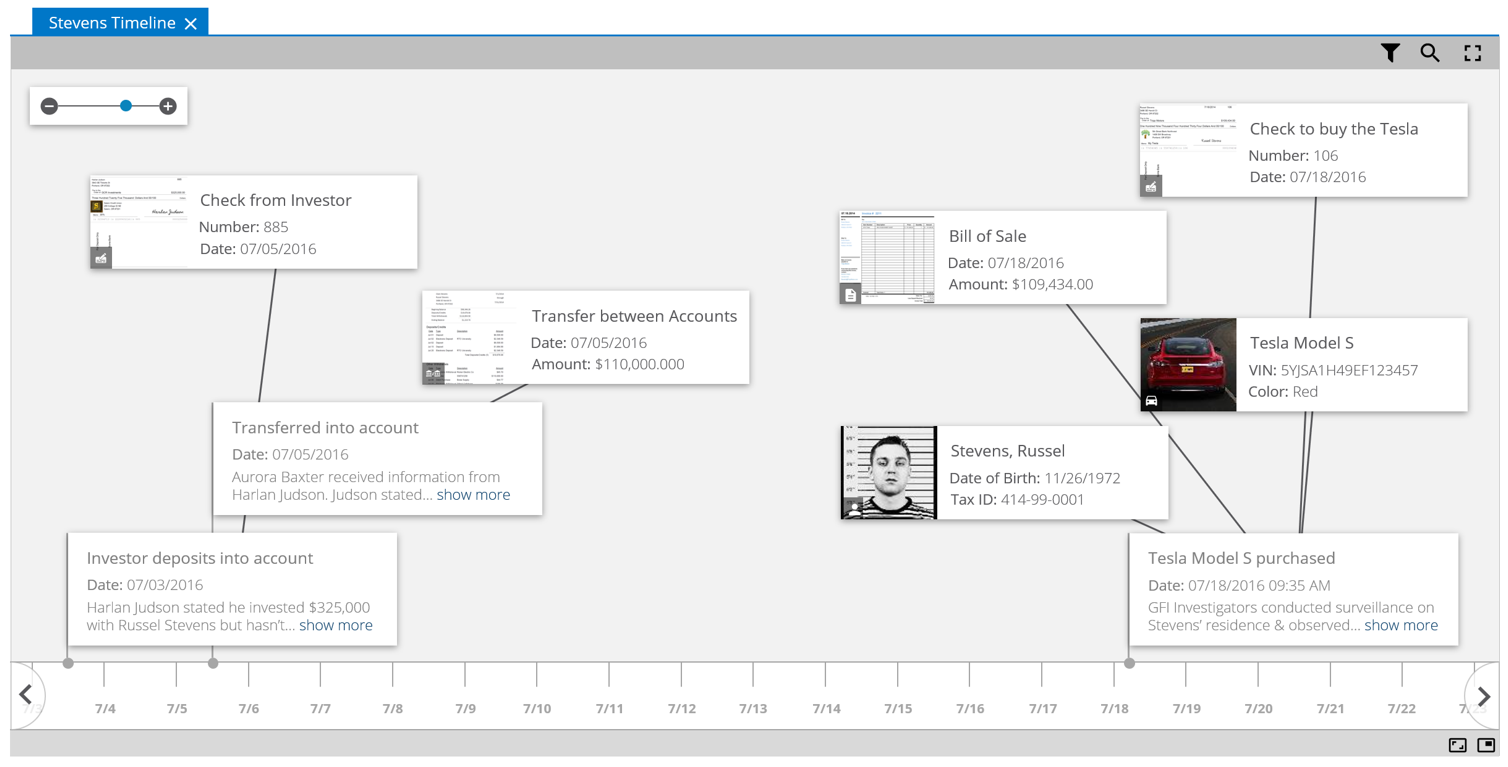
Linked Objects: The ability to show linked canvas objects on the timeline, to paint a more accurate picture

Swimlanes: The ability to compare two or more timelines to each other
Data Input & Analysis
Description
Slate exists to make investigations easier. Two major ways this is being addressed through the reduction of rework, and streamlining data input.
Problem
Investigators spend a considerable amount of time analyzing and entering investigation data. Some of the cases my team worked included over a million pages of evidence. With the rise of digital data on smartphones, even a basic local police investigation can have thousands of pieces of evidence.
Solution
The enhanced Slate viewer concept allows users to input new objects while viewing evidence by simply highlighting text. It also identifies potential matches for existing objects in the database, which users can quickly confirm and add to links to the existing object, or add a new object.
Maps
Description
Like timeline, many products exist in the market to visualize items on a map. Again, these solutions don’t meet the investigators’ requirements; their functionality doesn’t go far enough.
Problem
Other solutions they aren’t integrated with other investigation data, and most don’t support layers or custom data types. Law enforcement users regularly rely on geolocation data, whether from geotagged evidence (e.g., smartphone photos), or from location tracking on-vehicle devices.
Solution
Slate’s map shows all canvas objects that have geolocation data. If there is location tracking information, those routes would also show. Objects and information layers, such as location tracking, can be filtered and/or turned off.